


Diagrams and visual representations of ideas are a powerful method of communication. However, setting up the shapes, space, text and other diagrammatic variables can often be time-consuming, but not any more. By using the Diagram feature in Google Drawing this has now become a simple process.
[bctt tweet=” Use #Google #Drawings to quickly create visual diagrams! ” username=”donnagolightly1″]
A recent update that now allows you to create a diagram in Google Drawing and then embed that diagram in Google Docs has made this tool even more powerful. If you update the diagram in Drawings you are then prompted to update it within the Doc you have embedded it in – magic!
Read on to find out how this process works:
Step One:
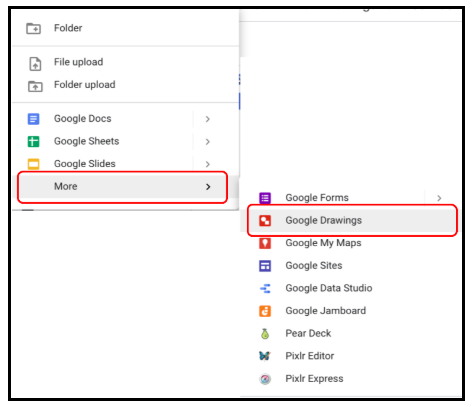
Navigate your way to a new Google Drawing. Make sure you open the folder where you want the Drawing to live, click on ‘New’ then ‘More’ and you’ll find Drawings there.
Step Two:
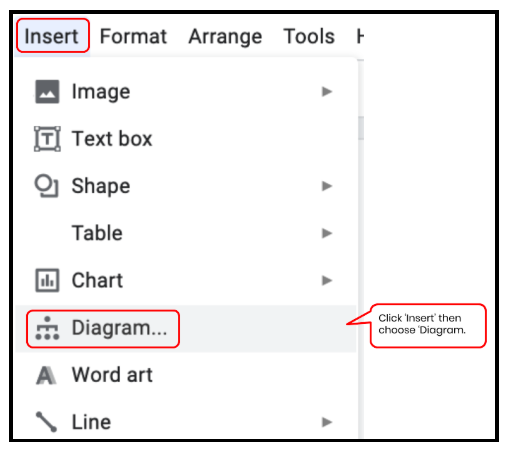
Click on the ‘Insert’ tab and you’ll see the ‘Diagram’ option.
Step Three:
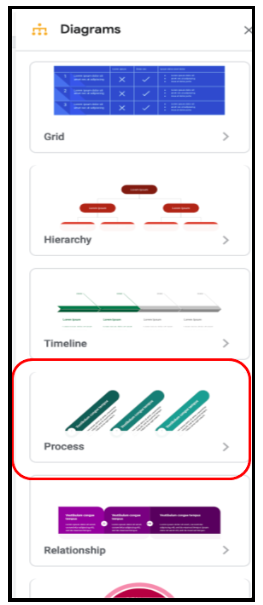
The diagram options toolbar will open on the right hand side.
Choose the type of diagram you want to use from the six different styles available:
- Grid
- Hierarchy
- Timeline
- Process
- Relationship
- Cycle
[bctt tweet=”#Google #Drawings has six different diagram formats for you to use – create visuals quickly and easily!” username=”donnagolightly1″]
Step Four:
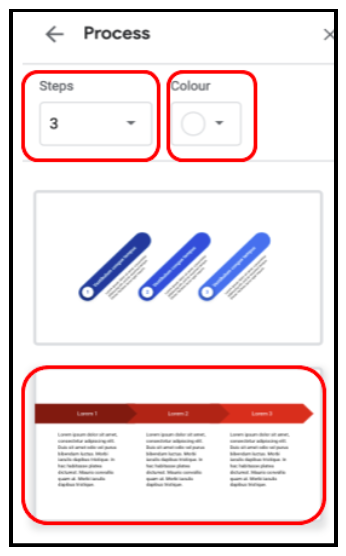
Once you’ve selected the style of the diagram you want to use you can then customise it further by deciding how many steps you need and the colour you want to use.
Step Five:
Once you’re happy with the number of steps within your diagram and the colour you’ve chosen, simply click on it and it will drop into your Drawing.
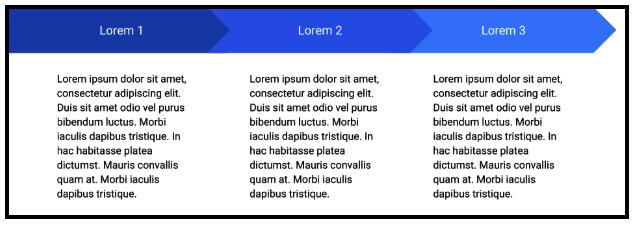
Now you’re ready to add your content.
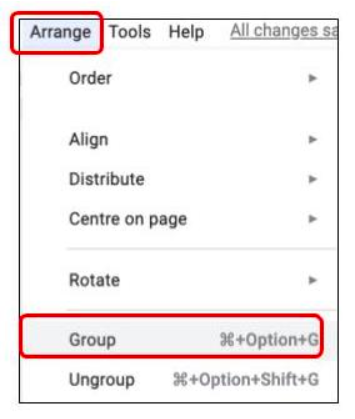
At this stage, it’s a great idea to select all the content and group it so that you can then move it or resize it as one object. If you don’t do this you’ll end up having to resize or move each individual piece – which can become quite frustrating!
To add your own text – highlight the text that is acting as the placeholder and simply type your own content into the space.
Once you’ve represented your information with visual impact, by creating a diagram, you can then embed it into a Google Doc. This is incredibly handy, as although there is a Google Drawing feature built into Docs, it doesn’t have the full range of tools that the standalone version has.
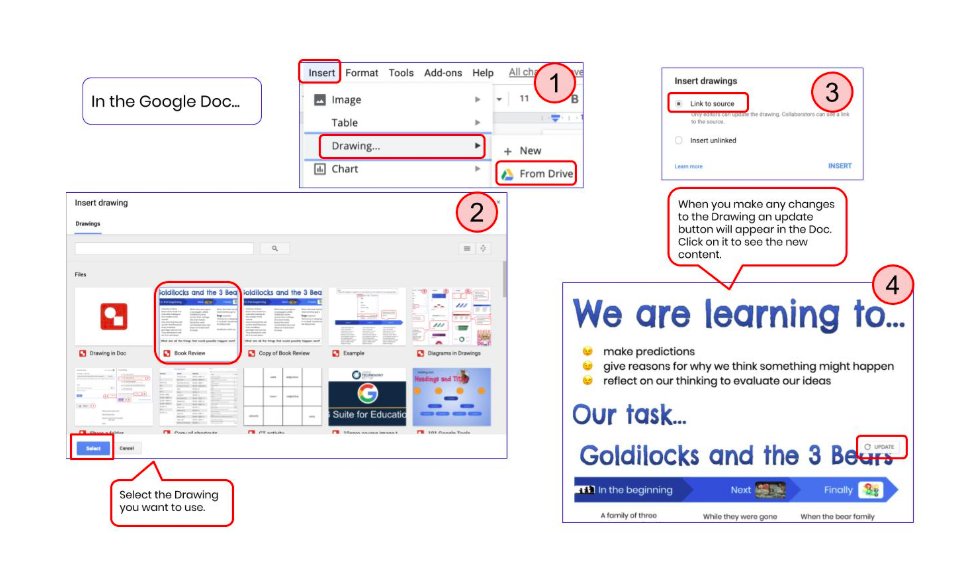
In your Google Doc, click the ‘Insert’ tab and select ‘Drawing’ then choose ‘From Drive’.
Find the Drawing you want to embed.
Choose to link it to the source.
When the Drawing is updated, the next time you open the Doc you will be prompted to update the Drawing there.
[bctt tweet=”Embed #Google Drawings in #GoogleDocs and they’ll update when you add to the Drawing!” username=”donnagolightly1″]
There are so many ways to use this awesome feature – we’d love you to share the ways you use it with us.
If you’d like to find out more about Google tips and trick check out our online Google courses here or check out our Google training here.