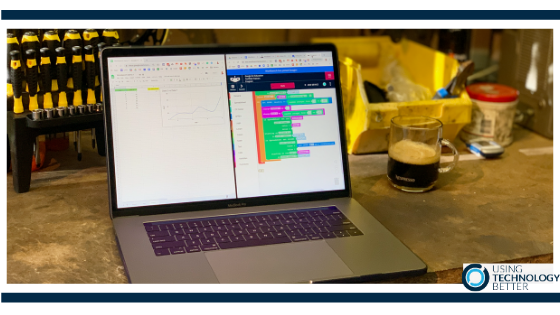
This is the final blog in the series on using Workbench. In this blog, we look at using the programming canvas to read and write multiple sets of data to a spreadsheet by incorporating a conditional loop.
[bctt tweet=”This blog post will show you how to create a chart that can show real-time data using the programming canvass in Workbench #googleedu #workbenchedu” username=”adifrancis”]
Because we can read and write data via code, we are also able to collect data from external devices like a micro:bit. By incorporating data validation and charts, we can write code to read and write multiple sets of data and then display this in a live-updating chart.
In this 10:08 minute video, you will learn how to read and write multiple sets of data, use data validation to control the sample size and use multiple variables and blocks in the programming canvass expanding on what has been shown the previous posts. Click to watch the video.
Have you missed the other blogs in this series? Don’t panic! To access the blogs:
- Click here for the first blog
- Click here for the second blog
- Click here for the third blog
- Click here for the fourth blog
Want to learn more? Then keep an eye out for an upcoming blog where we link a micro:bit to Workbench and record live temperature data or check out our online courses.


